Step-by-Step Guide
Dashboard Overview
Learn how to navigate and understand the Vixor user dashboard.
📊 Dashboard Overview
The Vixor dashboard is the main control panel where you can view and manage all aspects of your market-making activity. It provides real-time data, performance indicators, and quick access to essential tools.
🖥️ Navigating the Dashboard
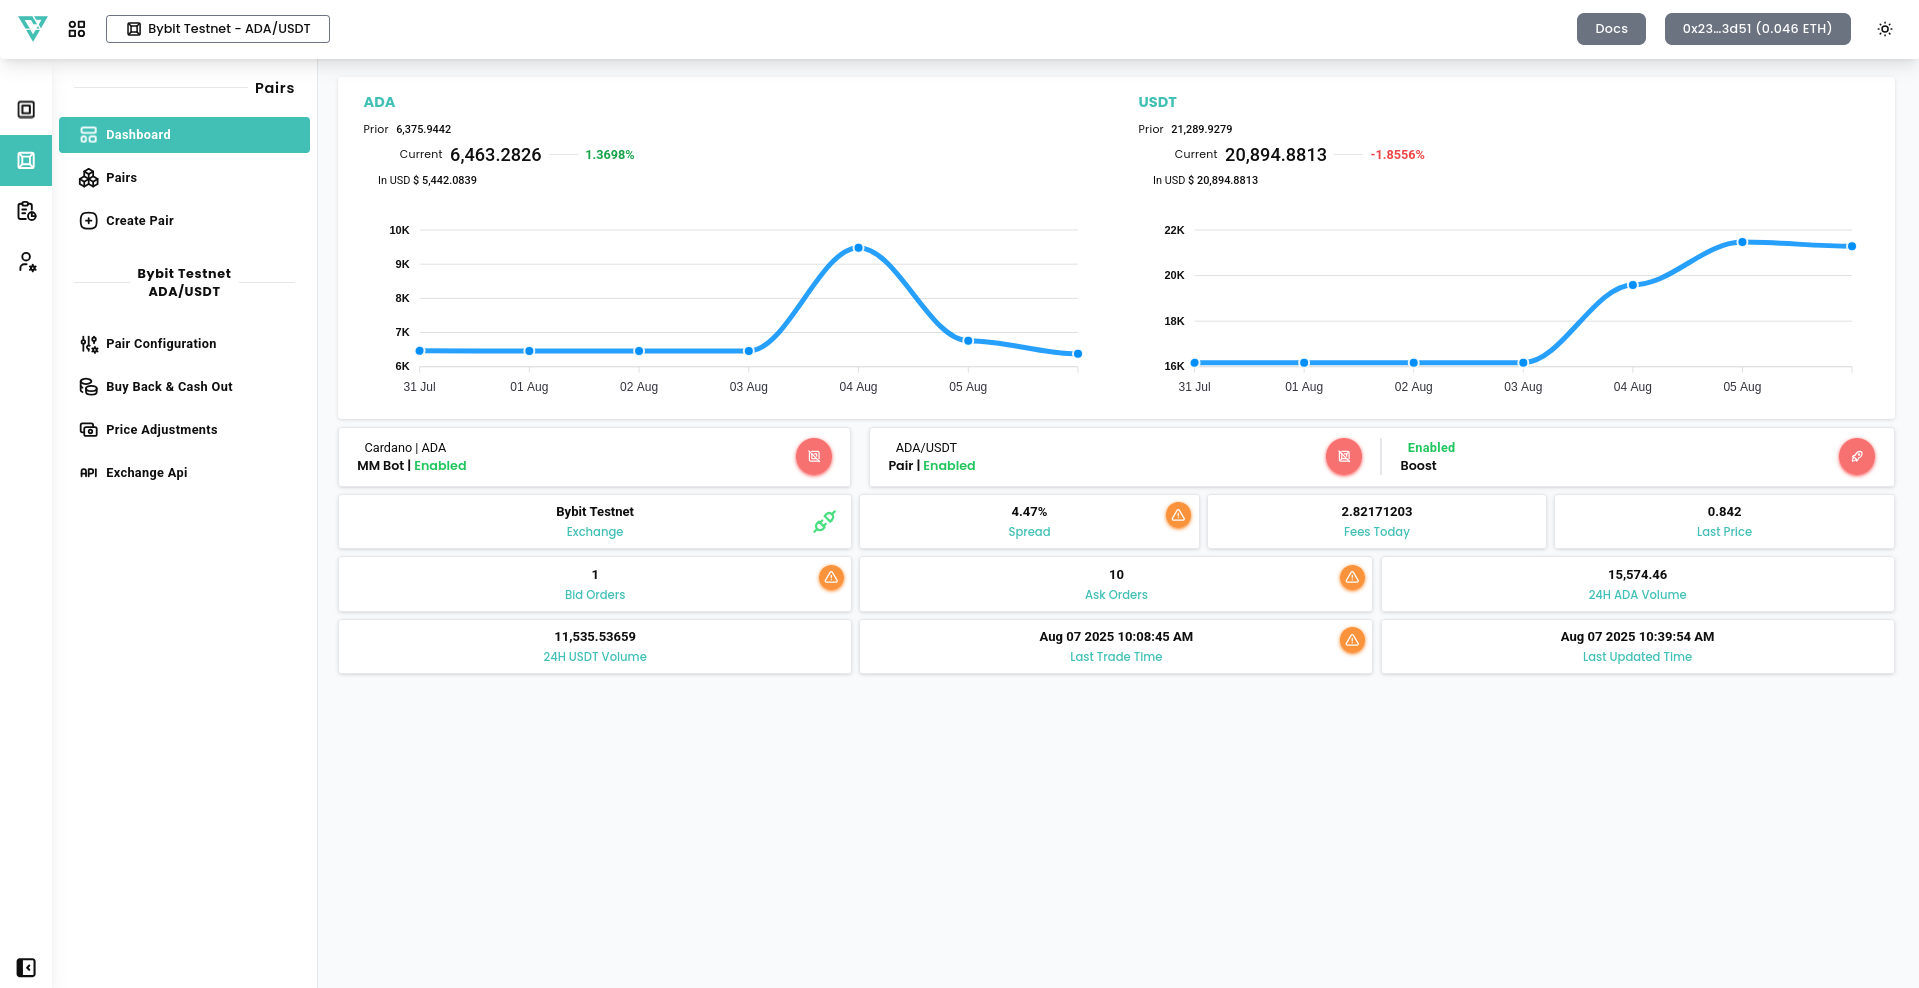
Once your wallet is connected, you’ll land on the Dashboard screen. Here's a breakdown of what you see:
🔷 Top Graphs
- Prior vs. Current Balances – Track the performance of your trading pairs (e.g., ADA/USDT) by comparing current balances against previous periods.
- Balance Performance Charts – Visualize balances trends of your selected trading pairs over last 7 days.
🔶 Status Section
- Project & Pair Status – Indicates whether your project and selected trading pair are active (
Enabled) or inactive. - Boost Mode – Shows if volume-boosting mode is active for the selected pair.
🧮 Market Metrics
- Spread – Displays the current spread percentage. A large spread may affect trading efficiency.
- Last Price – The most recent trade price for the selected pair.
- Bid/Ask Orders – Number of buy and sell orders currently live in the market by the bot.
- 24H Volume – Token-specific 24-hour trading volume.
- Fees Today – Total fees collected for the day through MM activity.
- Last Trade Time – Timestamp of the last executed trade.
- Last Updated Time – Timestamp of the latest data refresh.
This dashboard offers a complete snapshot of your MM operations, allowing you to monitor performance and make decisions with clarity. In the next step, we’ll explain how to create and configure your trading pairs.
