Step-by-Step Guide
Spread History
Track bid-ask spread percentages across exchanges to evaluate trading efficiency.
📐 Spread History
The Spread tab provides a historical view of your project's bid-ask spreads across supported pairs and exchanges. This metric is vital in determining how efficiently your market-making strategy narrows the price difference.
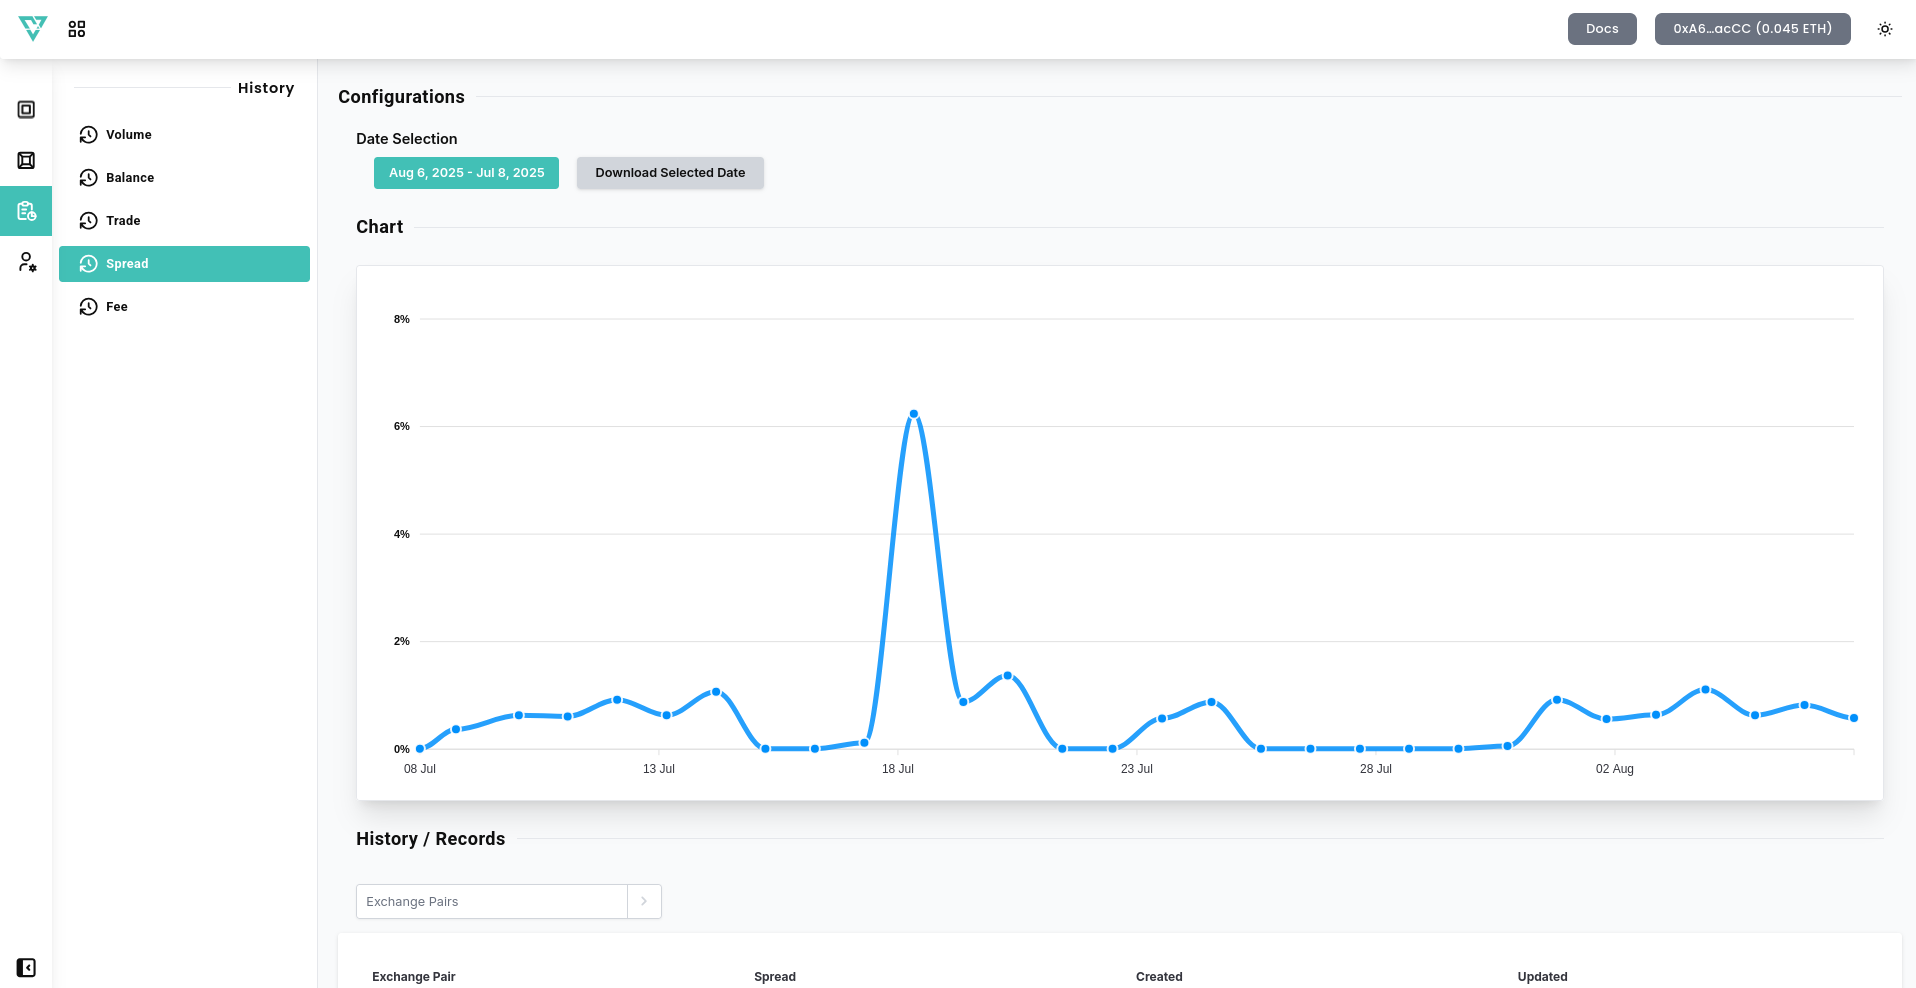
🧭 Chart Options
- Date Options – Select any range to analyze spread performance.
- Download Selected Date – Export daily spread logs for selected dates as csv file.
📊 Spread Visualization
- The chart shows Daily Average Spread Percentage over time.
- Each line represents a unique trading pair.
- Data reflects the percentage difference between the highest bid and lowest ask.
📈 A lower spread usually means more efficient trading and better liquidity perception.
📋 History / Records
- View each spread value along with its creation and update timestamps.
- Filter by pair to investigate specific trading environments.
Monitoring spread trends allows token projects to detect inefficiencies or sudden market disruptions. Combined with volume and trade data, spread metrics give you a full picture of how your token is performing in real-time environments.
