Step-by-Step Guide
Trade History
Explore detailed trade activity including buy/sell price averages and volumes.
🔄 Trade History
The Trade tab provides a visual and tabular view of executed buy and sell transactions. This allows project managers to monitor real-time market impact and user interaction.
📆 Chart Options
- Date Options – Choose the date range you want to analyze.
- Download Selected Date – Export trade history data for selected dates as csv file.
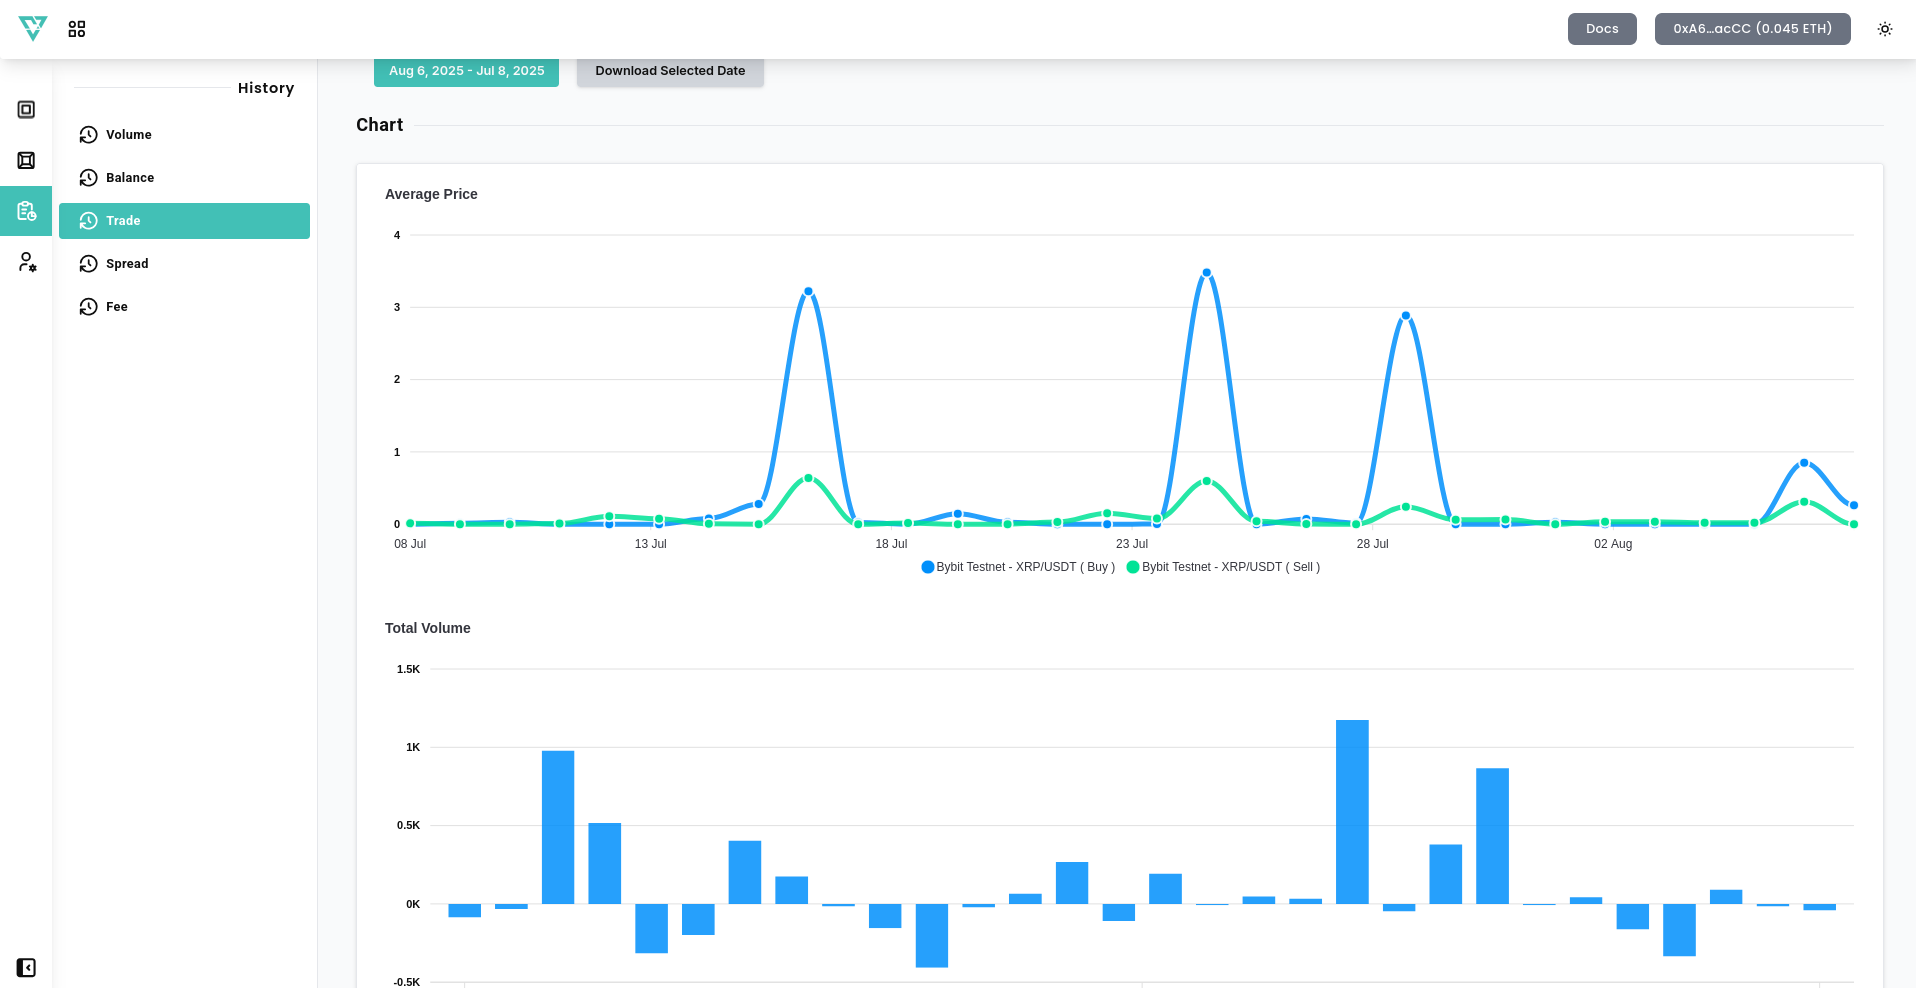
📈 Chart Breakdown
1. Average Price
- Displays the daily average Buy and Sell prices.
- Separate lines represent each trading pair's buy and sell (e.g., XRP/USDT, XRP/ETH).
2. Total Volume
- Bar chart shows Net Traded Volume per day.
- Above the median: Buy volume greater than sell volume.
- Below the median: Sell volume greater than buy volume.
🔍 Use this section to identify trading spikes or irregular pricing trends across time.
📄 History / Records
Detailed trade logs are accessible at the bottom:
- Pair – The trading pair involved.
- Average Buy/Sell Price – Average Buy/Sell Price for organic orders per day.
- Buy/Sell Total Volume – Total Buy/Sell Volume of organic orders per day.
- Net Amount – Net Size of organic orders.
📌 Filter by pair to locate specific trades quickly.
Trade history offers direct insight into how your market-making configuration is performing. Use this tool to fine-tune strategies, respond to unusual price actions, and ensure transparency for your project stakeholders.
