Step-by-Step Guide
Volume History
View and analyze daily trading volumes across your pairs on Vixor.
📊 Volume History
The Volume tab in the History panel provides a visual breakdown of trading volumes across your project’s active pairs. You can filter, analyze, and export this data for any date range.
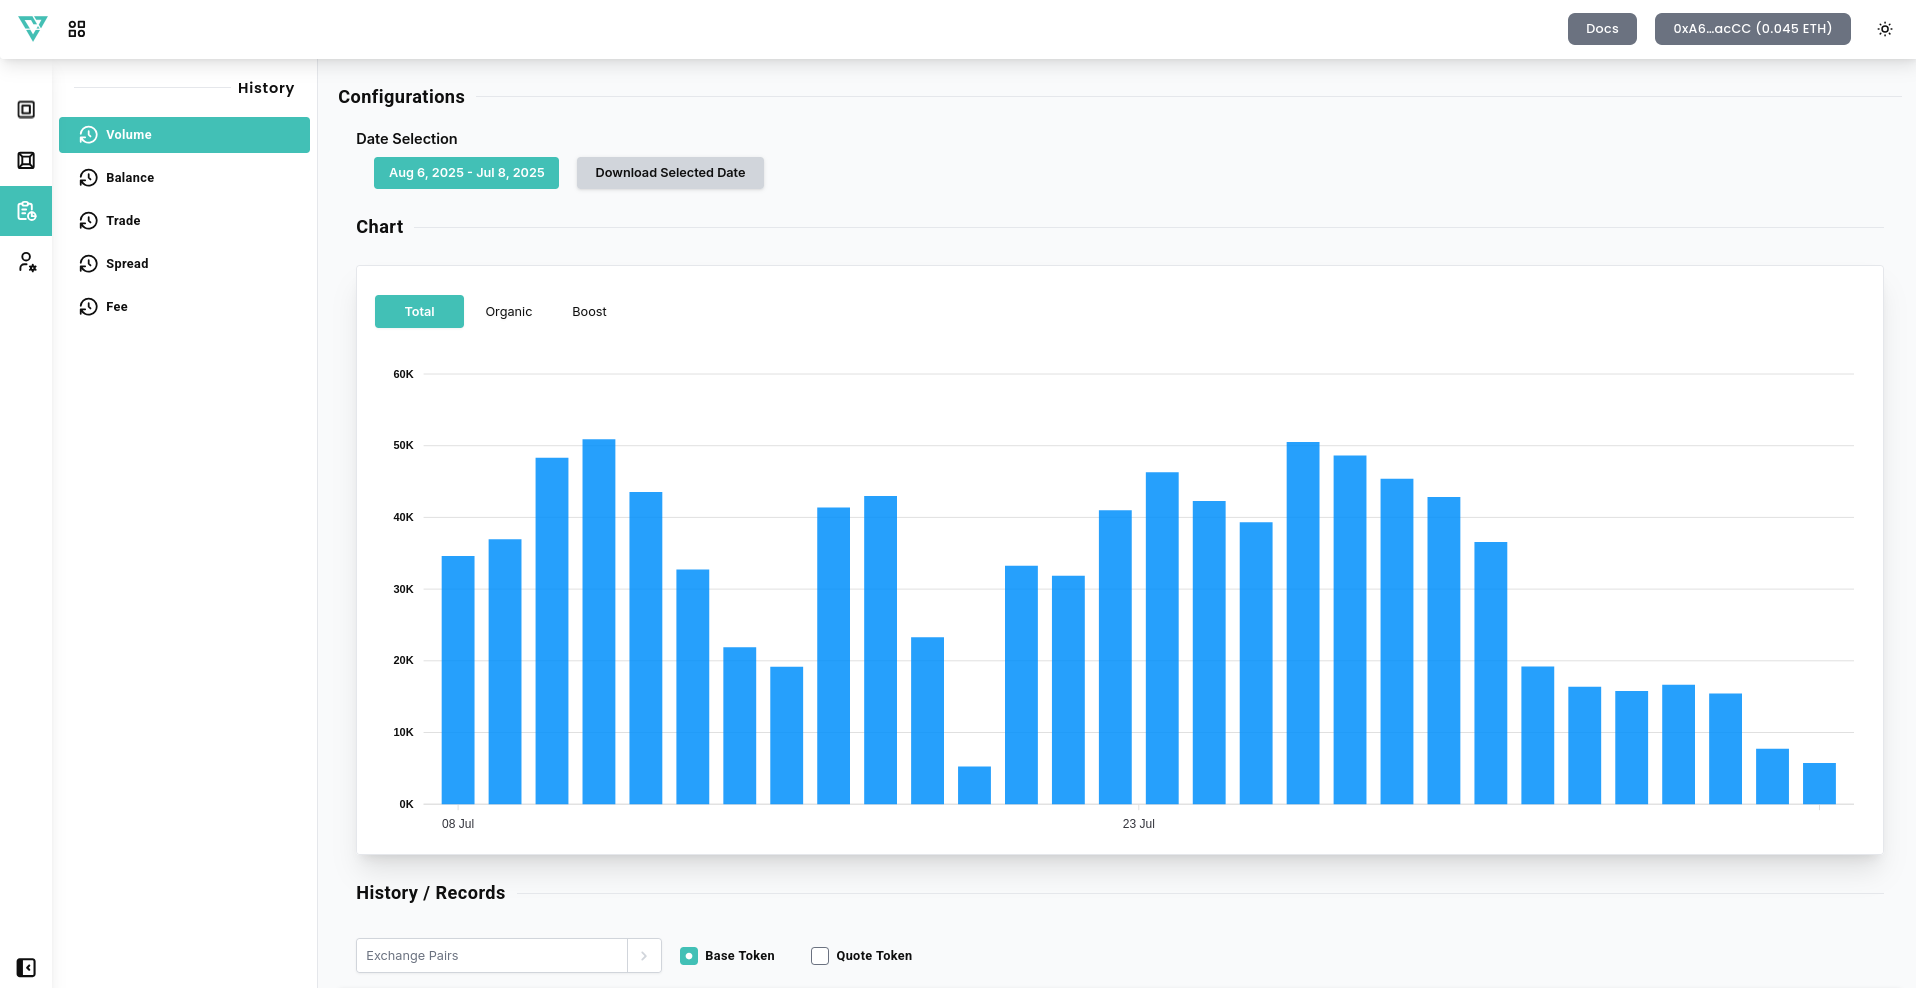
🔍 Chart Options
- Date Options – Use the calendar selector to pick your desired date range.
- Download Selected Date – Export volume history for the selected date as a csv file.
📈 Volume Types
Toggle between different volume categories:
- Total – Combined volume from organic and boost-driven trades.
- Organic – Natural trades without boost influence.
- Boost – Trades generated from your activated Boost Strategy.
🗂️ Chart Visualization
Each bar on the chart represents one day’s volume for selected pairs. Colors distinguish different pairs.
💡 Hover over each bar to see exact values in Base or Quote token units.
🔎 History / Records
Below the chart, you’ll find a searchable and filterable table:
- Select a trading pair.
- Toggle between Base and Quote volume.
- View transaction records for each day.
Monitoring volume trends is essential to understanding your market impact. Use this tool to track growth, assess MM performance, and optimize your strategy over time.
