Step-by-Step Guide
Fee History
Review transaction fees generated across trading pairs and exchanges.
💸 Fee History
The Fee tab provides a detailed breakdown of trading fees generated by your token across all enabled pairs and exchanges. This data helps measure trading activity and the cost-efficiency of your market-making operations.
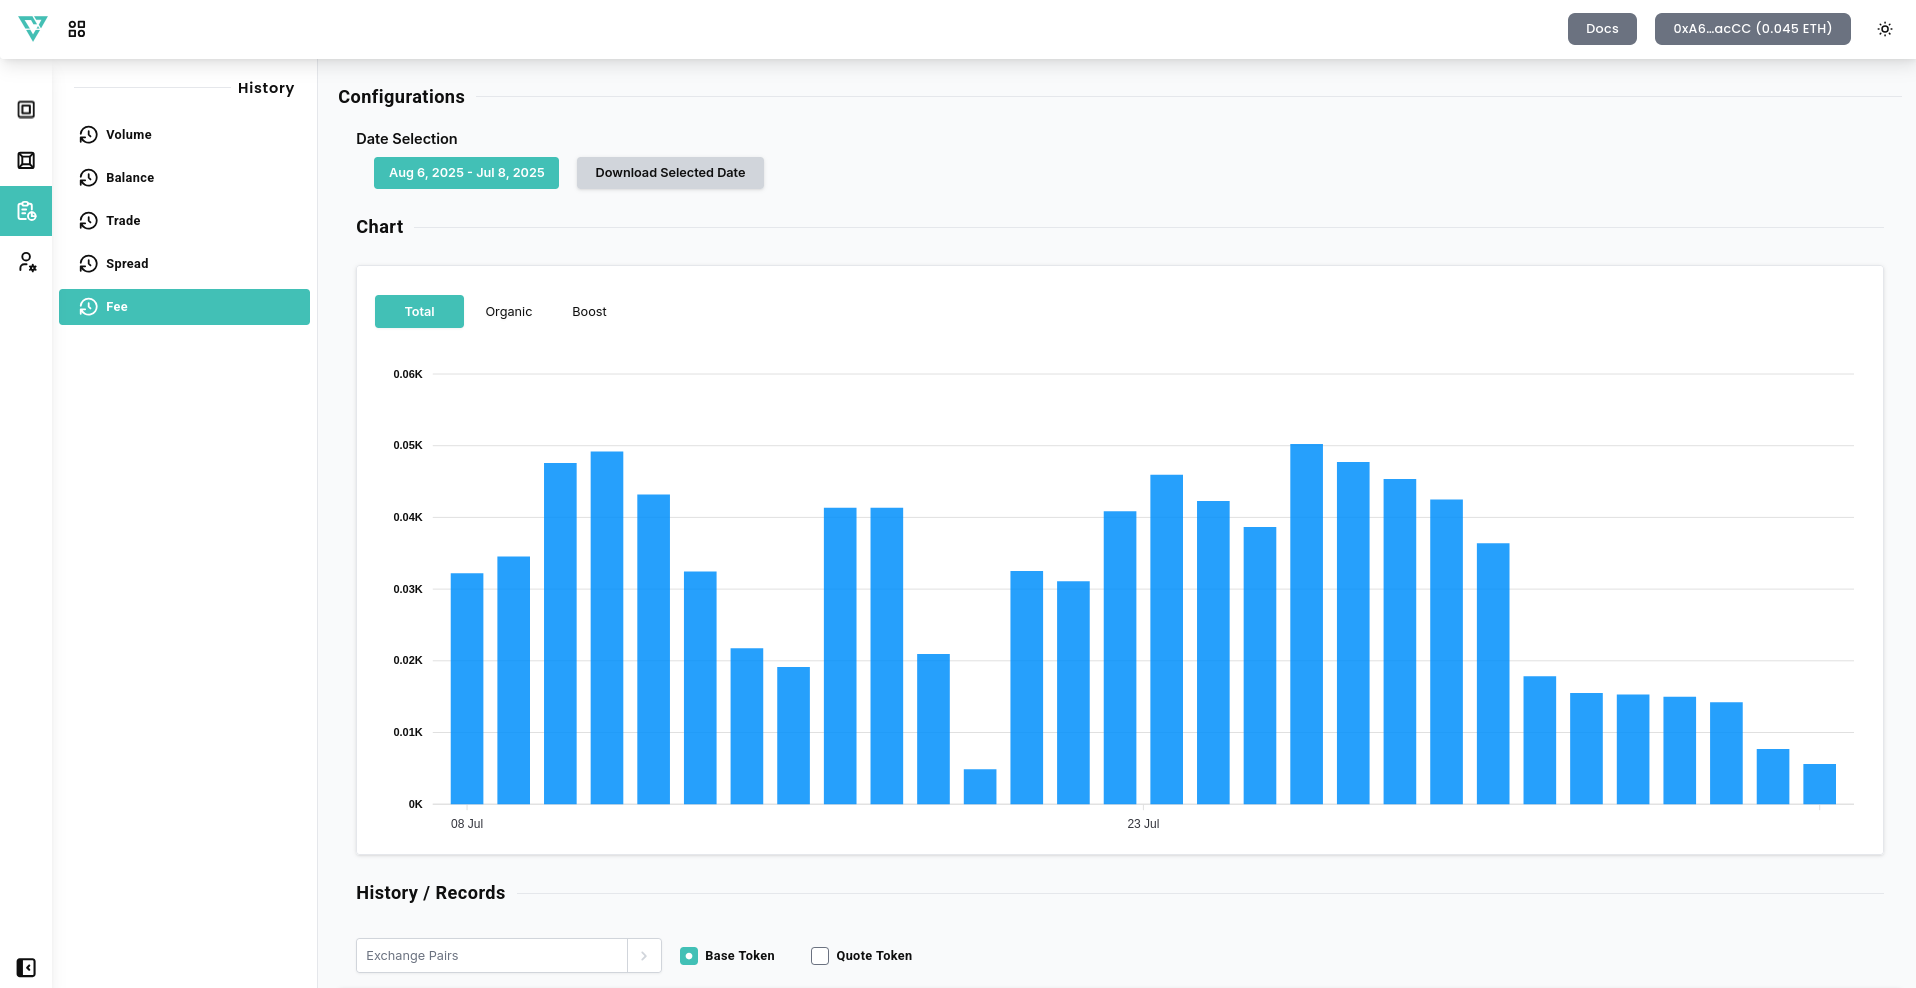
⚙️ Chart Options
- Date Options – Filter fees by custom date range.
- Download Selected Date – Export fee history for the selected dates as a CSV file.
📈 Fee Visualization
- The stacked bar chart shows daily fee accumulation.
- Each color represents a different trading pair.
- Tracks both base and quote token fee values.
🔍 Use this data to evaluate how effective your fee-generating activity is over time, especially when running campaigns or boost sessions.
📋 History / Records
- Shows fee totals per day per pair.
- Toggle between Base and Quote tokens to analyze separately.
Understanding fee generation is key for optimizing your token's trading performance and estimating long-term sustainability of your MM strategy on Vixor.
